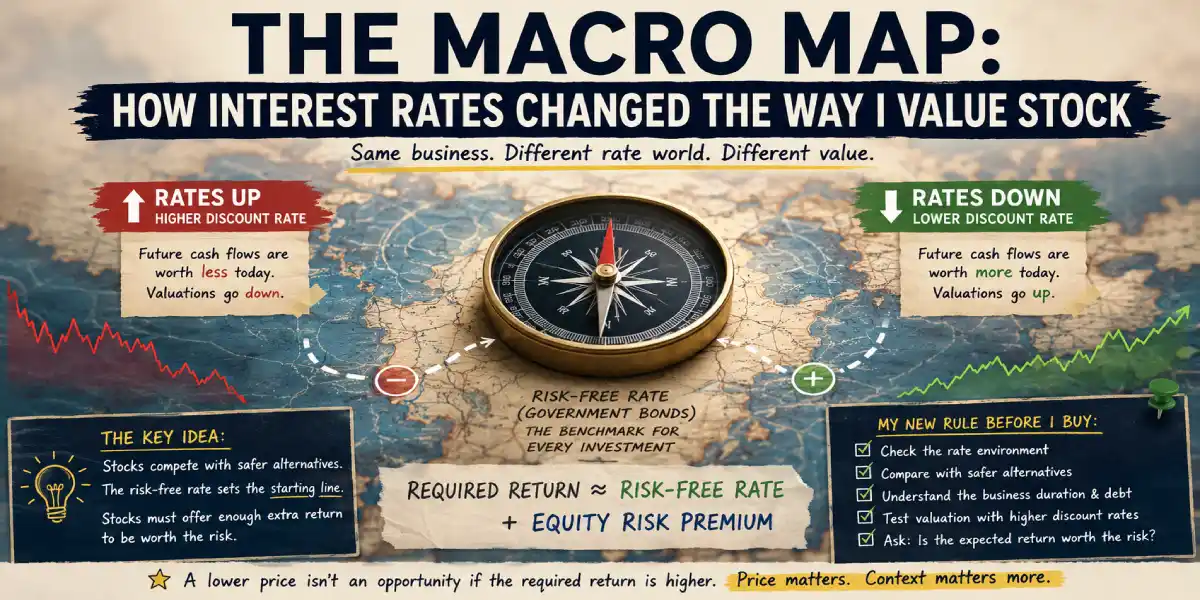
Future profits look exciting until safer investments start paying real returns. Interest rates do not decide which businesses win, but ignoring them can make you pay too much for even a good company.
I used to think analyzing a stock was like analyzing a car. You look under the hood, check the engine (revenue), inspect the interior (management), and see how fast it can go ( growth). If it’s a good car, it’s a good buy (btw I don’t like cars 😜 I would have used a PC example, but I think the car analogy is understood by everybody).
So, I would find a company I liked, verify that it was making money, and buy the stock. Then, I’d watch in absolute confusion as the stock price slowly bled out over the next six months, even though the company was still reporting record profits. I thought I was just terrible at picking stocks. I thought my analysis was flawed. Then I learned about “The Macro Map”.
I realized I was trying to figure out how high my car could jump without realizing someone had cranked up the gravity on the entire planet (round or flat depends which fan you are). In the financial world, gravity has a name: Interest Rates. If you are a beginner like me, trying to build a disciplined process and stop making emotional mistakes, you have to understand this one brutal truth: you cannot analyze a stock in a vacuum. If you don’t know what the Central Banks are doing with interest rates, you are flying blind.
Interest rates do not control everything, don’t get me wrong. They influence the price investors are willing to pay, the cost of debt, and the attractiveness of alternatives such as bonds. But a genuinely excellent business can still perform well in a high-rate environment, while a weak business can fail even when rates are low.
Interest rates are the gravity in my valuation process: they do not decide every outcome, but ignoring them means I may be valuing a company in the wrong environment so here is my attempt to explain what I’ve finally started to understand about the financial universe’s gravity, where I went wrong, and the rule I’m using moving forward.
I was learning to analyze companies, but I had ignored the number that changes what every future dollar is worth. When I started trying to become an investor rather than someone who bought stocks because they simply felt right, I focused on businesses. Revenue growth. Profit margins. Free cash flow. Debt. Competitive advantage. Management. Valuation multiples. Competitors. Industry position. That sounded sensible, and it still is.
But I was missing an uncomfortable point: a company does not exist in a vacuum. A stock is not valued in a sealed room where only its earnings matter. Every investment competes against alternatives, and one of the most important alternatives is the return available from government bonds. That return is often called the risk-free rate , Warren Buffett on why he chose bonds over stocks during the financial crisis or another good read How Warren Buffett’s 90/10 Rule Simplifies Investing for Average Investors
I do not have a dramatic personal story here where I bought a stock the day before the Federal Reserve raised rates and lost half my account. I could invent a cleaner story, but that would defeat the entire point of writing this blog honestly.
My real mistake is simpler: I had started thinking about company valuation without properly understanding one of the basic inputs behind valuation. I could look at a company growing its cash flows and think, “This looks attractive” but I was not asking:
- What return can I already get from safer government bonds?
- What extra return am I demanding for owning this risky business?
- Has the interest-rate environment changed since the stock previously looked cheap?
- Am I comparing today’s valuation to a period when money was much cheaper?
That was a major blind spot. Let’s take a look at some history. In 2022, this blind spot became painfully visible across the market. In March 2022, the Federal Reserve raised its target federal funds rate to 0.25%–0.50%. By December 2022, the target range had reached 4.25%–4.50%. Over that same calendar year, Invesco QQQ, an ETF tracking the Nasdaq-100, returned approximately -32.5%.
That does not prove that rates alone caused every decline. Inflation, earnings expectations, investor fear, war, and
changing growth assumptions also mattered (context is always important). But it is a
powerful example of what happens
when the market suddenly demands a higher return for future profits.
Federal Reserve issues FOMC statement 2022
Federal Reserve issues FOMC statement 2026
This article is my attempt to build the missing macro map into my investing process. Not so I can predict every Federal Reserve meeting. Not so I can become a trader reacting to headlines, but so I stop analyzing a business while ignoring the financial gravity around it.
The mistake: I was analyzing companies as if interest rates were background noise
My investing education journey has mostly started from the company level. That is natural in my view. Beginners are usually told to find good businesses, understand their products, study their revenues and margins, and avoid gambling on random price movements. That is exactly the direction I want to follow.
But there is a danger in focusing only on the company. Imagine I am studying an AI technology company (these companies currently attract enormous attention). Its revenue is growing. Its profit margins are improving. Its product has a large market. Analysts expect earnings to be much higher in five or ten years.
I might reasonably think:
This is a good business. Maybe I should buy it.
But that thinking was incomplete. A good business is not automatically a good investment at every price. The price I should be willing to pay depends partly on the return available elsewhere. This is opportunity cost: if I can earn an attractive return from a safer Treasury bond, a stock must offer enough additional potential return to justify the extra risk. When government bonds offer almost no yield, investors may accept paying a high price for stocks with profits expected far into the future. The alternative is not very attractive.
When government bonds offer a meaningful yield, the comparison changes. A risky stock now needs to offer enough potential return to justify uncertainty, volatility, possible business failure, and the emotional cost of owning it; this is the part I had not built into my thinking. I understood, in a vague way, that “high rates are bad for stocks”. But vague understanding is not an investing process, it is just a slogan.
The real questions are more practical:
- Why do higher rates reduce what future cash flows are worth today?
- Why do expensive growth stocks often suffer more when rates rise?
- Why should a beginner care about Treasury yields before buying a stock?
- Does a high-rate environment automatically mean I should not invest?
- What should I actually check before making a decision?
Those are the questions I needed to answer before pretending I understood valuation.
The simple explanation: money has an opportunity cost
The phrase risk-free rate sounds more academic than it needs to be. In practice, it usually means the return available from a very safe government security, such as a U.S. Treasury bill or Treasury bond.
It is not literally free of every possible risk: inflation can reduce purchasing power, interest-rate changes can affect bond prices, and nothing in finance is completely without uncertainty. But U.S. Treasury yields are commonly used as the starting benchmark for valuation because the probability of repayment in U.S. dollars is treated as extremely high.
The basic idea is simple: before I take risk in a stock, I should know what return I can get without taking that business risk.
Suppose I am considering investing in a company whose future profits are uncertain. If a safe Treasury bond offers almost 0%, I may accept a lower expected return from that stock because the safer alternative gives me very little. But if a Treasury bond offers 4% or 5%, the stock has to clear a much higher hurdle. Why would I take the risk of a business losing customers, missing earnings, issuing more shares, taking on debt, or disappointing investors unless the potential reward is clearly better than the safer alternative?
That is why the risk-free rate matters. It is the starting line and a risky investment needs to offer something above that line.
The Federal Reserve itself describes one way of thinking about the equity risk premium as the difference between the earnings yield on stocks and a long-term real interest rate. In simpler language: investors compare what stocks may earn against what safer assets may already offer.
This does not mean the Federal Reserve directly decides what every stock is worth. It means that interest rates change the competition for investors’ money, bottom line a stock is not competing only against other stocks. It is competing against Treasury bills, government bonds, corporate bonds, savings products, money market funds, real estate, and the choice of doing nothing (yes, we have that choice too).
When safe returns rise, risky assets must work harder to deserve capital.
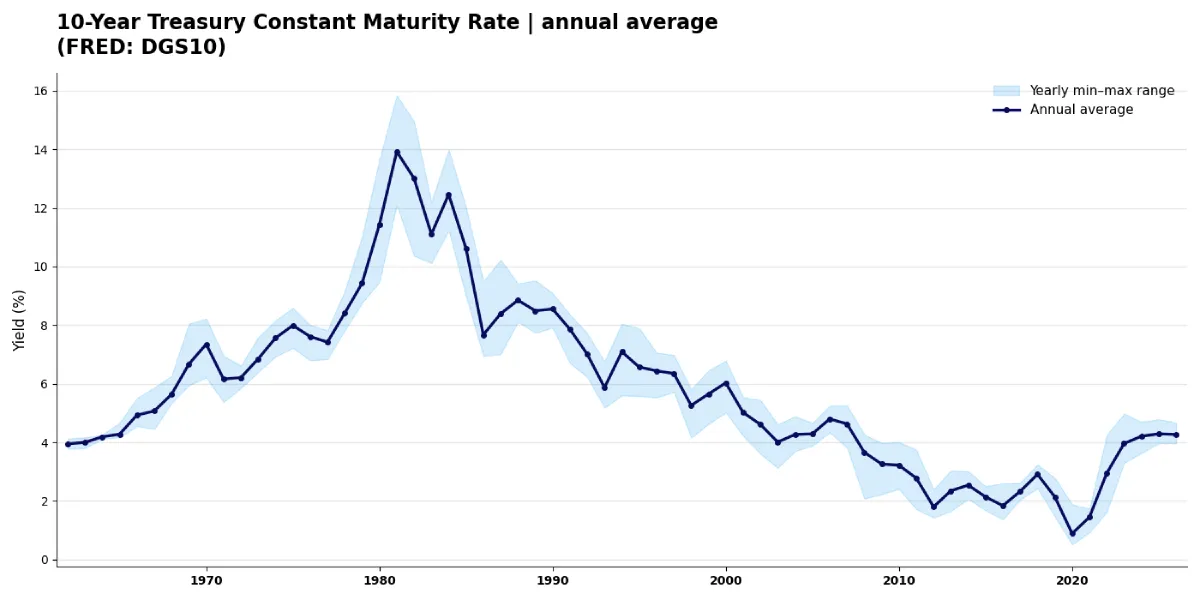
And that hurdle does not stay still. The chart below is the annual average yield on the 10-year U.S. Treasury going back to the 1960s, and what strikes me is the range: close to 16% at the early-1980s peak, almost nothing around 2020, and back near 4.5% today. The safe return I compare every stock against has swung enormously inside a single investing lifetime, which means a price that looks sensible in one rate environment can look reckless in another.
Why higher rates usually push stock valuations down
A stock represents ownership in future cash flows, the important word here is future. If a company earns money today, that money is valuable now. If it may earn money ten years from now, I need to decide what that future money is worth today.
A dollar received ten years from now is worth less than a dollar received today because:
- I cannot use it today.
- Inflation may reduce what it buys.
- The company may fail to deliver it.
- I could invest money elsewhere in the meantime.
This is where discount rates enter valuation. The higher the return I demand, the less I should pay today for future money.
Consider a deliberately simple example. Imagine a company is expected to generate $100 of cash for investors ten years from now (ignore all other complexity for a moment). If my required return is 5%, that future $100 is worth approximately $61.39 today. If my required return rises to 8%, that same future $100 is worth only approximately $46.32 today. Nothing changed in the future cash flow, it is still $100, what changed was the return I demand for waiting and taking risk and the present value fell by about 24.6%.
That is the key reason rates matter so much for stock valuations: when the discount rate rises, future cash flows become less valuable today. This is especially painful for companies whose expected profits are far into the future.
A mature, profitable company generating large cash flows today is affected by higher rates, but much of its value already exists in current earnings. A high-growth company priced on the assumption of enormous profits many years from now can be more sensitive. The market is paying today for money that may arrive much later. Increase the discount rate, and the current price that makes sense can fall sharply.
This does not mean growth companies are bad investments. It means paying any price for growth becomes especially dangerous when rates rise. That is a lesson I needed to learn before looking at a rapidly growing business and automatically calling it attractive.
The Federal Reserve is not a stock picker, but I cannot ignore it
In the United States, the Federal Reserve influences short-term interest rates through its federal funds rate target range. The Fed is not setting the price of Microsoft, Nvidia, Micron, AMD, Intel, Coca-Cola, Meta, or any ETF I or you might study. It is not deciding whether a particular company has a durable competitive advantage. But its decisions influence borrowing costs, bond yields, economic demand, inflation expectations, and the return investors demand from risky assets and that matters in several ways.
First, higher rates make borrowing more expensive. Companies with debt may need to refinance at higher interest costs. A business that looked profitable when borrowing was cheap may become weaker when debt costs rise. This matters particularly for businesses that depend heavily on borrowing, have weak cash flows, or need repeated access to capital markets.
Second, consumers and businesses may spend less. When mortgages, car loans, credit cards, and corporate borrowing become more expensive, spending and investment can slow. A company may still be well managed, but its customers may become more cautious with their spending.
Third, bonds become more attractive competitors If safe or relatively safe investments offer higher yields, investors may no longer be willing to pay extreme valuations for risky shares.
Fourth, valuation multiples can compress. A company may continue growing revenue and earnings while its stock price falls because investors are no longer willing to pay the same multiple for each dollar of earnings and this is a trap for beginners, because, we may look at the company and say:
But the business is still growing. Why is the stock down?
Sometimes the answer is not that the business suddenly became terrible. Sometimes the market simply changed the price it is willing to pay for future growth. As of the Federal Reserve’s April 29, 2026 meeting, the target federal funds rate range was 3.50%–3.75%. That is materially different from the near-zero environment that influenced many asset prices earlier in the decade. Any valuation comparison that ignores this difference risks comparing companies across completely different financial conditions.
For example, companies such as Charter Communications (NASDAQ: CHTR), Medical Properties Trust (NYSE: MPT), Warner Bros. Discovery (NASDAQ: WBD) (pending Paramount Skydance combination), Caesars Entertainment (NASDAQ: CZR) and AT&T (NYSE: T ) show why debt matters when interest rates remain high.
These businesses carry substantial borrowings, and in several cases interest payments consume a meaningful part of available cash flow. When existing debt matures, refinancing at higher rates can reduce earnings, limit investment and leave less money available for shareholders.
By contrast, companies such as NVIDIA (NASDAQ: NVDA), Microsoft (NASDAQ: MSFT), Meta (NASDAQ: META), Alphabet (NASDAQ: GOOG Class C, NASDAQ: GOOGL Class A) or Berkshire Hathaway (NYSE: BRK.A, NYSE: BRK.B) are in a stronger position. They hold large cash reserves, generate substantial operating cash flow, or both. Higher rates may still affect their customers and valuations, but the businesses themselves are much less dependent on refinancing debt simply to remain financially comfortable.
A real example: the 2022 rate shock and growth-stock pain
The cleanest real-world example is not one individual stock, it is the Nasdaq-100 and/or QQQ. QQQ is useful here because it represents many large, growth-oriented companies. These are often businesses where investors are willing to pay for substantial future profits.
At the beginning of 2022, investors were coming out of a period of extremely low interest rates. Growth companies had enjoyed strong enthusiasm. Cheap money made distant future earnings appear more valuable, and then the environment changed.
On March 16, 2022, the Federal Reserve raised its target rate range to 0.25%–0.50%, beginning a major tightening cycle. By December 14, 2022, the Fed had raised the target range to 4.25%–4.50%.
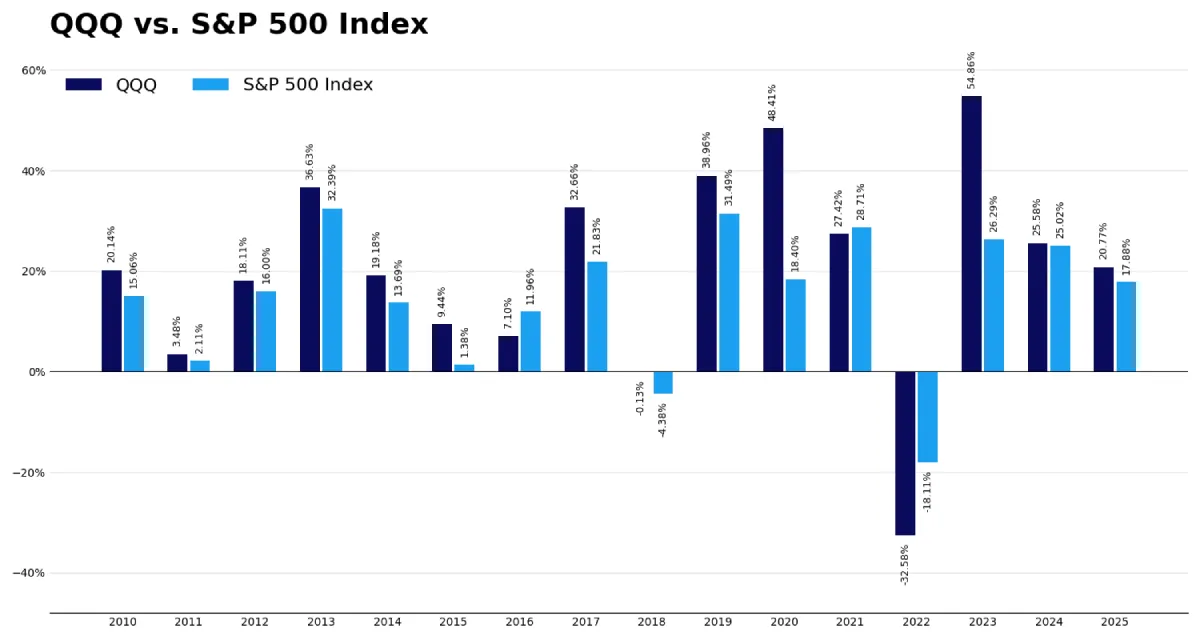
Meanwhile, the yield on the 10-year U.S. Treasury rose sharply during 2022. FRED, using Federal Reserve H.15 data, records the 10-year Treasury constant maturity yield as a daily series and identifies it as a market yield on U.S. Treasury securities. FRED And QQQ fell substantially in 2022, as interest rates rose sharply, the Invesco QQQ Trust lost ~32.58% on a total-return basis, even after accounting for reinvested dividends.
The same story shows up when I put QQQ next to the broader S&P 500. Through most of the cheap-money 2010s, the growth-heavy Nasdaq-100 beat the S&P year after year, exactly what you’d expect from a longer-duration, growth-tilted basket when rates are low. Then 2022 flipped it: as rates jumped, QQQ fell about −32.58%, far worse than the S&P 500’s −18.11%. The index that won the most when money was cheap lost the most when the discount rate rose.
The beginner interpretation might be:
Technology stocks collapsed because technology suddenly became bad.
That is too shallow, a better interpretation is:
The market was no longer willing to value long-term growth using the same low-rate assumptions.
Some businesses faced real operating problems, some expectations were too optimistic, some prices had simply become excessive. Inflation and geopolitical uncertainty mattered. But rising rates changed the valuation environment for the entire category and we can visually see it in the graph. This is important because it changes how we should learn from market history.
The lesson is not:
Never buy growth stocks when rates rise.
That is too simplistic and probably harmful, the lesson in my view should be:
When a stock’s valuation depends heavily on profits far into the future, you need to be much more careful about the discount rate, the valuation multiple, and the price you are willing to pay.
A great company bought at an unrealistic price can still be a bad investment. A growing business can deliver respectable results and still see its stock fall if investors had previously paid too much for those results. This is where you need discipline rather than excitement.
My beginner valuation worksheet: the same business, two different rate worlds
To make this practical, I need more than a historical chart. I need a simple exercise I can repeat when I analyze a company and prep my thesis. Suppose I am studying a hypothetical business and I estimate that it will generate:
- $10 of cash flow per year for the next ten years
- A terminal value of $150 at the end of year ten
The terminal value is my estimate of what the business may be worth after the first ten years. That estimate is imperfect, and in real investing it can easily become the most dangerous part of a valuation because it depends on assumptions about growth, profitability, and what future investors may be willing to pay.
This is not a recommendation or a forecast for a real company. It is simply a way to see how the same business can appear less valuable when the required return rises. The valuation question is simple:
What are those future cash flows worth to me today if I require a 5% return, compared with requiring an 8% return?
$$ PV = \sum_{t=1}^{10}\frac{10}{(1+r)^t}+\frac{150}{(1+r)^{10}} $$
Valuation sensitivity: same cash flows, higher required return:
| Part of the valuation | At a 5% discount rate | At an 8% discount rate | Change |
|---|---|---|---|
| Present value of $10 annual cash flows for 10 years | $77.22 | $67.10 | -$10.12 |
| Present value of $150 terminal value in year 10 | $92.09 | $69.48 | -$22.61 |
| Estimated value today | $169.30 | $136.58 | -$32.72 |
Figures may not sum exactly due to rounding.
At a 5% required return, my estimated value for the business is approximately $169.30.
At an 8% required return, the same business, producing the same estimated future cash flows, is worth approximately $136.58.
That is a fall of about 19.3% in estimated value.
The business did not lose a customer, revenue did not decline, management did not resign and the product did not become obsolete, only the return I demanded from the investment changed.
That is the part of valuation that I had not properly understood before. A company can continue doing exactly what I expected, while the price I should rationally be willing to pay still falls because safer alternatives now offer a better return or because investors demand more compensation for taking risk.
The table also reveals something important: the terminal value gets hurt the most.
At a 5% discount rate, the terminal value contributes $92.09 to my valuation. At an 8% discount rate, it contributes only $69.48. That single distant assumption loses $22.61 of present value, accounting for most of the overall decline.
There is a name for this. In the bond world, how much a price reacts to interest-rate changes is called duration: the longer I have to wait for my money, the longer the duration, and the more its value moves when rates change. A short-term Treasury bill barely reacts; a thirty-year bond swings a lot. Cash flows inside a stock behave the same way.
My terminal value is the most distant money in this valuation, so it has the longest duration, which is exactly why it lost the most when I raised the required return. It is also the deeper reason growth stocks tend to fall harder when rates rise: most of their value sits far in the future, so the whole company behaves like a long-duration asset.
This matters because beginner valuations can easily become too dependent on terminal value. I can build a spreadsheet that looks precise, but if most of my estimated value comes from what I assume the company will be worth ten years from now, I am relying heavily on a future I cannot see clearly.
That does not mean terminal value is useless. Any long-term business valuation needs some way to account for cash flows beyond a short forecast period.
But it does mean I should be suspicious of my own confidence.
If my investment case only works because I assume a generous future valuation, low interest rates, strong growth, and patient investors, then I may not have found a bargain. I may simply have built a spreadsheet that agrees with what I already wanted to believe.
For a beginner, I do not think the answer is to build an enormously complicated spreadsheet full of false precision. Your first version should be simpler:
| Question | What I should check |
|---|---|
| What is the business earning now? | Revenue, operating profit, free cash flow |
| How uncertain are future earnings? | Growth assumptions and competitive risk |
| Does the company have debt? | Interest expense and refinancing needs |
| What can I earn from safer alternatives? | Treasury yields or cash yields |
| Am I paying mainly for distant future growth? | Valuation multiple and free cash flow assumptions |
| What happens if my required return rises? | Recalculate value using a higher discount rate |
The point is not for me to predict interest rates precisely. The point is to stop valuing a company as though it exists in a silo. My thesis needs context: what safer investments offer, what return I should demand for taking risk, whether the company carries debt, and how much of its value depends on distant future cash flows. I may still make mistakes, but at least they will be based on a more informed process rather than an incomplete one.
The risk-free rate: the hurdle my stock must beat
Here is the part I want to remember in plain language. Suppose a U.S. Treasury investment offers a meaningful yield. Before I take the additional uncertainty of owning a company, I need to understand why that stock deserves my money instead.
The simplified relationship is:
$$ \text{Required Return on a Stock} \approx \text{Risk-Free Rate} + \text{Equity Risk Premium} $$
The risk-free rate is my starting point: the return available from a comparatively safe government investment.
The equity risk premium is the additional return I should demand for accepting the risks of owning a business: disappointing earnings, competition, management mistakes, debt problems, dividend cuts, falling valuations, and permanent loss of capital.
This formula is simplified. Nobody hands me a perfectly reliable equity risk premium for an individual stock, and different investors can reasonably demand different returns. But the principle matters: a risky investment must offer me a reason to choose it over a safer alternative.
Federal Reserve research has described estimates of the equity risk premium by comparing stock-market earnings yields with real Treasury yields. That is useful as a way of thinking about the trade-off, but it is not an official rule that tells investors exactly what stocks are worth.
A Treasury bond does not give me the upside of an excellent business. It will not suddenly grow revenue, gain customers, expand margins, or compound earnings for decades, but it gives me a benchmark. If a safer Treasury investment already offers a meaningful return, then a company such as AT&T must offer enough additional expected value to justify the extra risks I would accept as a shareholder: competition, large capital requirements, debt refinancing, management decisions, dividend uncertainty, and share-price volatility.
The point is not that AT&T is automatically attractive or unattractive. I would still need to study its financial statements, debt, cash flow, dividend sustainability, valuation, and competitive position.
The point is that I cannot say:
The dividend looks attractive, so I should buy the stock.
I need to ask myself:
After comparing this company with safer alternatives, am I being compensated enough for the additional risks?
That is a different question. The first question can make me chase yield, stories, or familiar company names. The second question forces me to consider price, risk, debt, opportunity cost, and the return I could earn without accepting the same business uncertainty. That is where investing starts to become more disciplined.
Why beginners get this wrong
I think beginners make at least five predictable mistakes around rates, I’ve done it, I’ve read about it so here are my top 5:
Mistake 1: We think a good company automatically means a good stock
This is probably the biggest trap.
A company can have excellent products, growing revenue, intelligent management, and strong long-term prospects. But if the stock price already assumes years of near-perfect growth, the investment may still be unattractive.
Higher interest rates make overpaying even more dangerous because the present value of distant future profits falls faster. This matters most for long-duration stocks: businesses whose valuations depend heavily on cash flows expected far into the future.
A great company bought at an unreasonable price can still produce a poor investment result.
Mistake 2: We compare today’s valuation with valuations from a low-rate period
A stock may appear “cheap” because it trades at a lower price-to-earnings multiple than it did during a period of nearly zero interest rates, but that does not automatically make it cheap now.
When Treasury yields and required returns are higher, investors may reasonably refuse to pay the same multiple for future earnings that they paid during a cheap-money period.
A stock trading below its previous high is not automatically undervalued. The old price tells me where enthusiasm once went. It does not tell me what the business is worth today.
Mistake 3: We react to rate headlines instead of understanding the mechanism
A beginner may hear, “The Fed might cut rates,” and rush into growth stocks. Or hear, “Rates may stay higher for longer,” and sell everything.
That is not analysis. That is emotional headline trading.
Lower rates can support stock valuations because future cash flows are discounted at a lower required return. But rate cuts do not automatically make stocks rise. The Fed may be cutting because the economy is weakening, consumer spending is slowing, unemployment is increasing, or company earnings are becoming less secure. A lower discount rate may help the valuation calculation while weaker earnings damage the business itself.
That is why “the Fed may cut, so I should buy growth stocks” is not a real investment thesis.
The more useful approach is to understand what rates may affect:
- Required returns
- Debt costs
- Consumer demand
- Business investment
- Valuation multiples
- Competition between stocks and safer assets
- Expectations for future earnings
Then I can evaluate whether a specific company is exposed to those forces.
Mistake 4: We treat macroeconomics as a prediction game
I do not need to predict the exact next Federal Reserve decision to benefit from understanding rates.
Trying to guess every meeting would probably make me trade more, become more emotional, and focus less on businesses.
My goal is not to become a macro forecaster. My goal is to understand the environment in which I am valuing a company.
There is a major difference between saying:
I know what the Fed will do next.
and saying:
Current rates are materially different from the near-zero period, so I should not blindly use the same valuation assumptions.
The second statement is more modest and far more useful.
Mistake 5: We forget that rates are only one variable
This is where my original title becomes dangerous.
Interest rates are important, but they do not explain every stock move.
A company may grow earnings fast enough to overcome valuation pressure. A business may have little debt and strong cash generation. A stock may already be cheap enough to tolerate higher rates. A company may fail because its product weakens, its balance sheet becomes dangerous, or management destroys value, regardless of what the Fed does.
Rates are not a magic answer. They are a necessary part of the map.
What I would do differently next time
Before learning about this topic, I might have analyzed a stock like this:
- Is revenue growing?
- Are profits increasing?
- Does the company have a convincing story?
- Has the stock price fallen?
- Does it look like a buying opportunity?
That is not enough. A business can grow while its stock stays overpriced. A stock can fall sharply and still not be cheap. A company can look stable while its debt becomes more expensive to refinance. A growth story can still disappoint if I pay too much for cash flows expected far into the future.
So now I add a second layer before considering a purchase.
First, I check the rate environment. I look at the latest Federal Reserve target range and a relevant Treasury yield, such as the 10-year, for a long-term comparison. Not because one number tells me whether to buy, but because it tells me what kind of environment I am valuing the company in.
Second, I ask whether the company is rate-sensitive. A business with heavy debt, weak current profits, and a case built mainly on distant earnings can be far more vulnerable to higher rates than one already producing strong cash flow today. This is where duration matters: the more of my estimated value sits in money arriving far in the future, the more sensitive my valuation is to a change in required returns.
Third, I test my valuation with more than one required return. If it only works when I assume very low returns, that is a warning. I do not need to be perfectly right; I need to see whether the investment still looks sensible under less comfortable assumptions.
Fourth, I stop using previous stock highs as evidence. A stock falling from $300 to $180 does not prove it is cheap. Maybe $300 reflected an unusually optimistic, low-rate period. Maybe $180 is still expensive. The old share price is not my valuation model and should not be yours either.
Fifth, I write down my reason for buying, before I buy. What the company does, why it may generate more cash in the future, whether its value rests mainly on current cash flow or distant expectations, whether it carries meaningful debt, what valuation I am paying, what safer return I am giving up, what rate environment I am analyzing it in, and what would prove me wrong. If I cannot explain those simply, I probably do not understand the investment well enough.
My one-page rate check
I do not want this article to become theory I forget in two weeks, so I keep one small routine I can reuse: before I research a stock deeply, I fill in a short rate check at the top of my notes. It forces me to slow down and compare opportunity against opportunity, not story against excitement.
To ground it in today: as of the Federal Reserve’s April 29, 2026 decision, the target range was held at 3.50%–3.75%, and the 10-year Treasury yield was 4.57% on May 21, 2026 (FRED). Those numbers will change, which is exactly why I record them on the day I analyze, rather than copying them permanently into my assumptions.
| Item | My note |
|---|---|
| Latest Federal Reserve target range | Record the range and meeting date |
| Current 10-year Treasury yield | Record the yield and date checked |
| Required return I demand for this stock | Risk-free benchmark plus extra return for risk |
| Is this a long-duration case? | Are most expected cash flows far in the future? |
| Does the company carry meaningful debt? | Check interest expense and upcoming maturities |
| What would prove my thesis wrong? | Write one clear sentence |
This turns “I like this company” into a more serious question: does this investment deserve my money at this price, with these risks, in the financial environment that actually exists today? That is the difference between learning about businesses and learning to invest.
Conclusion: I was not missing a stock tip. I was missing the map. I started this journey thinking company analysis meant understanding revenue, profits, products, competition, and valuation. It does. But that is not the complete job.
A business may produce cash in the future, but the value of that future cash depends on the return investors demand today. Government bond yields influence that demand. Federal Reserve policy shapes the rate environment. Debt costs, consumer spending, valuation multiples, and expectations for future earnings all feel the consequences.
I also understand something more clearly now: not every stock reacts to rates the same way. A business valued mainly on distant future profits behaves like a long-duration asset, and its price can be especially sensitive when required returns rise. A business generating strong cash flow today is less exposed to that exact mechanism, though it can still face debt, demand, and competitive risks.
So my rule is simple. Before I value or buy an individual stock, I check the rate environment, compare the company’s expected return with safer alternatives, ask whether it behaves like a long-duration investment, and test whether my valuation still makes sense under less comfortable assumptions.
That rule does not tell me what to buy. It does something more useful: it stops me from pretending a company’s future cash flows are worth the same in every environment. A lower stock price is not automatically an opportunity. A growing business is not automatically a bargain. A high dividend is not automatically attractive. A possible rate cut is not automatically a buy signal — especially if rates are being cut because earnings or the economy are weakening. Interest rates do not explain everything. They do not tell me which company will succeed, they do not replace understanding the business, and they do not mean I should panic whenever a central banker speaks. But they are too important to ignore.
My real mistake was never about losing money on a single rate decision. It was beginning to think about valuation without realizing one of its foundations was missing from my process.
From now on, I do not want to study a company in isolation. I want to understand the business, estimate what it may earn, ask whether its value rests on current cash flow or distant expectations, examine its debt, look at the price, check the rate environment, and then ask whether the potential return is good enough compared with safer alternatives. That is my macro map. Not a prediction machine. Not a shortcut. A reminder that every stock investment lives inside a financial environment and the price I pay matters as much as the company I admire.
Simple checklist: my interest-rate gut-check before buying
I use this in my thesis, as a final pass before any individual stock decision:
- I checked the latest Fed target range and the 10-year Treasury yield, and recorded the dates.
- I can state the simplified idea: required return ≈ risk-free rate + a premium for equity risk.
- I asked whether this is a long-duration case, is the value mostly near-term, or far in the future?
- I know whether the company carries meaningful debt, and checked its interest expense and upcoming maturities where available.
- I tested the valuation with a higher required return, not just the optimistic one.
- I considered whether a rate cut could arrive alongside weaker earnings.
- I compared the potential return with safer alternatives.
- I did not treat the previous stock high as proof that today’s price is cheap.
- I wrote one sentence on what would prove my thesis wrong and I can explain, plainly, why this stock deserves the extra risk.
Appendix
1. Reproduce the 10-Year Treasury Yield Graph with Python
View dgs10_yearly.py on GitHub
Comments
0